A young girl puts a pencil to her mouth in a pensive manner

When Did You First Think About Law School?

By Elizabeth Bodamer

I did not know a single attorney – not even one – until I was assigned a mentor my first year of undergrad. From there I met another lawyer, then another lawyer, and then another. During my senior year of college, as my eyes were set on law school as the next chapter in my life, my mother walked into the law school immigration clinic where a law student helped her fill out the paperwork to become a naturalized citizen. As I started law school, my mother proudly took the Oath of Allegiance as a new U.S. citizen after being here for more than two decades.

All through my childhood and adolescence, law was an abstract idea that never took concrete aspirational form until my mentors came into my life in college.

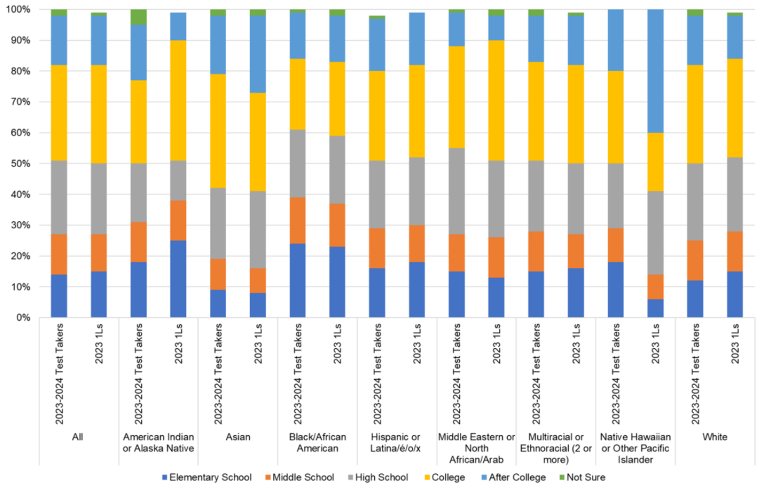
That’s not true for many individuals who are actively taking steps to apply to law school. For many current law students, they first thought about law school long before college. About half of 2023-2024 test takers and half of the 2023 1Ls first thought about law school before college, and the picture is even more striking for students from marginalized communities. For example, about a quarter of Black test takers and a quarter of Black 1Ls report first thinking about law school as early as elementary school.

When Did You First Think About Law School?

When did people first think about law school. Results from the post-LSAT questionnaire and the
matriculant survey of 1Ls. 
 All respondents
Elementary School
2023-2024 test takers:14%
2023 1Ls: 15%
Middle School
2023-2024 test takers: 13%
2023 1Ls: 12%
High School
2023-2024 test takers:24%
2023 1Ls: 23%
College 
2023-2024 test takers: 31%
2023 1Ls: 32%
After College
2023-2024 test takers: 16%
2023 1Ls: 16%
Not Sure
2023-2024 test takers: 2%
2023 1Ls: 1%
American Indian or Alaska Native 
Elementary School
 2023-2024 test takers: 18%
2023 1Ls: 25%
Middle School
2023-2024 test takers: 13%
2023 1Ls: 13%
High School
2023-2024 test takers: 19%
2023 1Ls: 13%
College 
2023-2024 test takers: 27%
2023 1Ls: 39%
After College
2023-2024 test takers: 18%
2023 1Ls: 9%
Not Sure
2023-2024 test takers: 6%
2023 1Ls: 0%
Asian
Elementary School
2023-2024 test takers: 9%
2023 1Ls: 8%
Middle School
2023-2024 test takers: 10%
2023 1Ls: 8%
High School
2023-2024 test takers: 23%
2023 1Ls: 25%
College 
2023-2024 test takers: 37%
2023 1Ls: 32%
After College
2023-2024 test takers: 19%
2023 1Ls: 25%
Not Sure
2023-2024 test takers: 2%
2023 1Ls: 3%
Black or African American
Elementary School
2023-2024 test takers: 24%
2023 1Ls: 23%
Middle School
2023-2024 test takers: 15%
2023 1Ls: 14%
High School
2023-2024 test takers: 22%
2023 1Ls: 22%
College 
2023-2024 test takers: 23%
2023 1Ls: 24%
After College
2023-2024 test takers: 15%
2023 1Ls: 15%
Not Sure
2023-2024 test takers: 2%
2023 1Ls: 3%
Hispanic or Latina/e/o/x
Elementary School
2023-2024 test takers: 16%
2023 1Ls: 18%
Middle School
2023-2024 test takers: 13%
2023 1Ls: 12%
High School
2023-2024 test takers: 22%
2023 1Ls: 22%
College 
2023-2024 test takers: 29%
2023 1Ls: 30%
After College
2023-2024 test takers: 17%
2023 1Ls: 17%
Not Sure
2023-2024 test takers: 1%
2023 1Ls: 0%
Middle Eastern or North African/Arab
Elementary School
2023-2024 test takers: 15%
2023 1Ls: 13%
Middle School
2023-2024 test takers: 12%
2023 1Ls: 13%
High School
2023-2024 test takers: 28%
2023 1Ls: 25%
College 
2023-2024 test takers: 33%
2023 1Ls: 39%
After College
2023-2024 test takers:11%
2023 1Ls: 8%
Not Sure
2023-2024 test takers: 2%
2023 1Ls: 2%
Multiracial or ethnoracial (2 or more) 
Elementary School
2023-2024 test takers: 15%
2023 1Ls: 16%
Middle School
2023-2024 test takers: 13%
2023 1Ls: 11%
High School
2023-2024 test takers: 23%
2023 1Ls: 23%
College 
2023-2024 test takers: 32%
2023 1Ls: 32%
After College
2023-2024 test takers: 15%
2023 1Ls: 16%
Not Sure
2023-2024 test takers: 3%
2023 1Ls: 1%
Native Hawaiian or Other Pacific Islander
Elementary School
2023-2024 test takers: 18%
2023 1Ls: 6%
Middle School
2023-2024 test takers: 11%
2023 1Ls: 8%
High School
2023-2024 test takers: 21%
2023 1Ls: 27%
College 
2023-2024 test takers: 19%
2023 1Ls: 32%
After College
2023-2024 test takers: 41%
2023 1Ls: 16%
Not Sure
2023-2024 test takers: 0%
2023 1Ls: 2%
White 
Elementary School
2023-2024 test takers: 12%
2023 1Ls: 15%
Middle School
2023-2024 test takers: 13%
2023 1Ls: 13%
High School
2023-2024 test takers: 25%
2023 1Ls: 24%
College 
2023-2024 test takers: 32%
2023 1Ls: 32%
After College
2023-2024 test takers: 16%
2023 1Ls: 14%
Not Sure
2023-2024 test takers:2%
2023 1Ls: 1%
Source: LSAC Data. The 2023-2024 PLQ and 2023 Matriculant Survey.

These insights are extremely valuable as we consider the assumptions the legal education community has made about why there is a lack of racial and ethnic diversity in legal education. The data can help us focus our collective efforts toward meaningful changes that create inclusive environments where people can flourish. 

As a researcher, these insights provide evidence that the lack of racial and ethnic diversity in the legal field is not solely related to disparities in early exposure to the possibility of a legal career. Rather, the current disparities in our legal profession are due to systemic barriers along the journey that impact skills development and how prospective applicants approach law school admission, how law schools recruit a diverse applicant pool focused on what is motivating prospective applicants and their needs, and how law schools are creating environments that are truly inclusive and conducive to learning. 

Early outreach and exposure is important, but it is just one point along a long and complex journey. These trends in the larger context of how people experience the journey to law school are evidence of the need for journey-wide interventions, cultivating aspirations and turning them into reality by addressing the multiple barriers that impede access to opportunities and resources.

To learn more, download LSAC’s Knowledge Report Series:

Elizabeth Bodamer

Senior Director of Research

Elizabeth Bodamer (she/her/ella) has a PhD in Sociology from Indiana University Bloomington and a JD from Indiana University Maurer School of Law.