Understanding and Interpreting Law School Enrollment Data: A Focus on Race and Ethnicity (RR 20-03)
The Law School Admission Council (LSAC) has a long-standing commitment to diversity, equity, and inclusion in legal education and in the legal profession. In line with its mission to promote quality, access, and equity in legal education, LSAC is providing a report, Understanding and Interpreting Law School Enrollment Data: A Focus on Race and Ethnicity, to help law schools, admission professionals, and other legal education stakeholders understand how we are measuring who is the pipeline. The purpose of the report is to inform conversations about diversity, equity, and inclusion in law school and recruitment efforts. The full report outlines the history of the Office of Management and Budget (OMB) data reporting standards, how these differ from LSAC data collection and reporting practices, and the social and cultural implications of different race and ethnicity data collection and reporting methods. This research brief summarizes the full report but focuses on how LSAC collects and reports race and ethnicity data, illustrated with two examples of how different data collection and reporting methods can affect how we understand application and enrollment trends.
Data Collection
In 1997, the OMB proposed revised standards for federal reporting on race and ethnicity and issued final guidelines in 2007. The purpose of the new guidelines was to standardize how race and ethnicity information is collected and reported. According to the OMB standards, when collecting data on race and ethnicity, individuals should first be asked to indicate whether they are of “Hispanic or Latino” ethnicity and then, in a subsequent question, should be asked to choose one or more of five racial categories (American Indian or Alaska Native, Asian, Black or African American, Native Hawaiian or Other Pacific Islander, and White). LSAC collects race and ethnicity data in a slightly different way by combining the Hispanic or Latino ethnicity question with the race question and using additional broad categories as well as a write-in option (Table 1).
Table 1: LSAC and OMB Race and Ethnicity Categories
|
LSAC (Since 2010) |
OMB Minimum Standards |
|---|---|
|
American Indian/Alaska Native |
American Indian or Alaska Native |
|
Black/African American |
Black or African American |
|
Caucasian/White |
White |
|
Hispanic/Latino |
Hispanics of any race |
|
Puerto Rican |
— |
|
Canadian Aboriginal/Indigenous |
— |
|
Asian |
Asian |
|
Native Hawaiian or Other Pacific Islander |
Native Hawaiian or Other Pacific Islander |
|
Indigenous Australian |
— |
|
— |
Two or More Races |
|
Decline to Respond |
Race and Ethnicity Unknown |
Note: See the full report for a more detailed table and explanation.
Data Reporting: What is Single and Maximum Reporting?
The OMB revised standards also set new reporting requirements for race and ethnicity data. The OMB standards require single reporting, while LSAC uses maximum reporting. With single reporting, per OMB data collection standards, respondents first choose whether their ethnicity is Hispanic or Latino and then select additional racial categories. However, when the data is reported, an individual selecting “Hispanic or Latino” is not included in any subsequent category of race. If not Hispanic or Latino, an individual designating a single race is counted in that category, but individuals designating more than one race are combined in a “Two or More” category.
With maximum reporting, data are collected by asking individuals to choose as many racial or ethnic categories with which they self-identify. Then, instead of lumping individuals who choose more than one racial category into a nondifferentiated “Two or More” category and excluding those who identify as Hispanic or Latino from subsequent racial category counts, as is the practice in single reporting, an individual is included in each race or ethnicity category that they select. In 2010, LSAC began using this method to report race and ethnicity data.
Practical Example: Diversity within “Two or More Races” Category
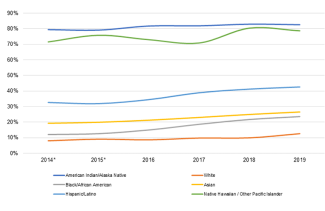
Maximum reporting reveals the diversity hidden by the inclusion of a “Two or More Races” category. This is illustrated by Figure 1, which presents the percentage of matriculants who indicated more than one race or ethnicity by specific race and ethnicity categories. In 2019, about 83% of American Indian/Alaska Native students indicated more than one race or ethnicity. Under OMB reporting, these students would be grouped into a “Two or More” category and disappear into a statistical aggregate. Using data aggregated in this way limits the ability to measure trends, differences, similarities, and needs of students who self-select one category and students who self-select multiple categories. Capturing diversity within groups is especially important for groups that are smaller in number, contain a large percentage of individuals self-identifying as being more than one race or ethnicity, and/or are underrepresented in legal education. All three of these apply to American Indian/Alaskan Natives, who make up a very small proportion of law students, over 80% of whom self-identify as being more than one race or ethnicity and continue to be underrepresented in legal education — especially when we refer to matriculants who only identify as American Indian/Alaska Native.
Figure 1: Percentage of Matriculants Indicating More than One Race or Ethnicity
Practical Example: Frequencies and Percentages
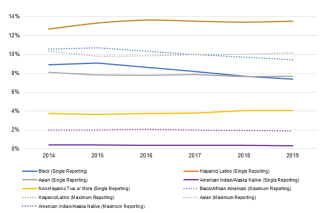
Choosing whether to display data as frequencies or percentages can also change how we understand diversity enrollment trends. We can see this clearly in Figures 2 and 3, which show enrollment trends from 2014 to 2019 by race and ethnicity. In Figure 2, both single and maximum reporting methods using frequencies show declining Asian matriculation, with the largest decline occurring from 2014 to 2015. However, both single and maximum reporting in Figure 3 indicate that the relative percent of Asian matriculants has remained about the same from 2014 to 2019 at about 8% for single reporting and at about 10% for maximum reporting. While frequency is important for tracking how efforts to improve the pipeline are impacting the number of students, percentage provides insight on the proportional relationship of diversity in the pipeline. Understanding proportional representation is especially important in order to see changes in representation by race and ethnicity.
Figure 2: Frequency of Matriculants by Race and Ethnicity
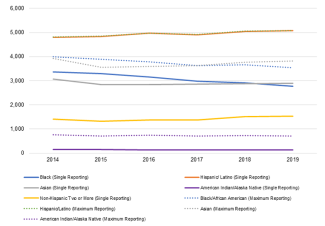
Figure 3: Percentage of Matriculants by Race and Ethnicity
Summary Conclusion
This brief summarizes differences between race and ethnicity data collection and reporting methods. Maximum reporting captures diversity more comprehensively than single reporting for minoritized groups, because it most accurately reflects the understanding that the lived experiences of individuals who self-identify as being of more than one race or ethnicity are based on all of their identities, not just one. In contrast, single reporting forces those analyzing data to assign primacy to one racial or ethnic identity and makes it more difficult to understand the impact of multiple racial and ethnic identities on all aspects of life.
The full report explores these differences in more depth, not just by clarifying the methodological differences in racial and ethnic data collection, reporting, and presentation, but also by explaining how these differences can inform our understanding of diversity in the pipeline as it relates to enrollment trends in law school. The full report is intended to start a broader conversation about measuring race and ethnicity through preselected categories that have social and cultural implications tied to individuals’ bodies. Inequality and inequity continue to persist in early, higher, and legal education along the lines of race, ethnicity, gender identity, sexual orientation, disability status, socioeconomic status (SES), and first-generation college student status. This inequality is often compounded at the intersection of individuals’ multiple devalued identities. Data is the key to understanding the scope and depth of inequality, but we must also acknowledge that data is not collected and used in a vacuum: It must be understood within the social and cultural contexts that provide the framework for how we, at the most basic level, conceive of inequality and the factors that contribute to it.

Quick Links
Table 1: LSAC and OMB Race and Ethnicity Categories
Figure 1: Percentage of Matriculants Indicating More than One Race or Ethnicity
Additional reports in this collection

